Leading and Lagging Safety Indicators in Construction
Use construction safety leading indicators, lagging outcomes, near misses, observations, corrective-action performance, TRIR, DART, and the Safety Triangle.
Lagging indicators describe outcomes that already occurred. Leading indicators show whether prevention activities and controls are operating before harm.
OSHA recommends using both. A contractor that watches only recordables learns late. A contractor that watches only completed inspections may confuse activity with effectiveness.
The Safety Triangle
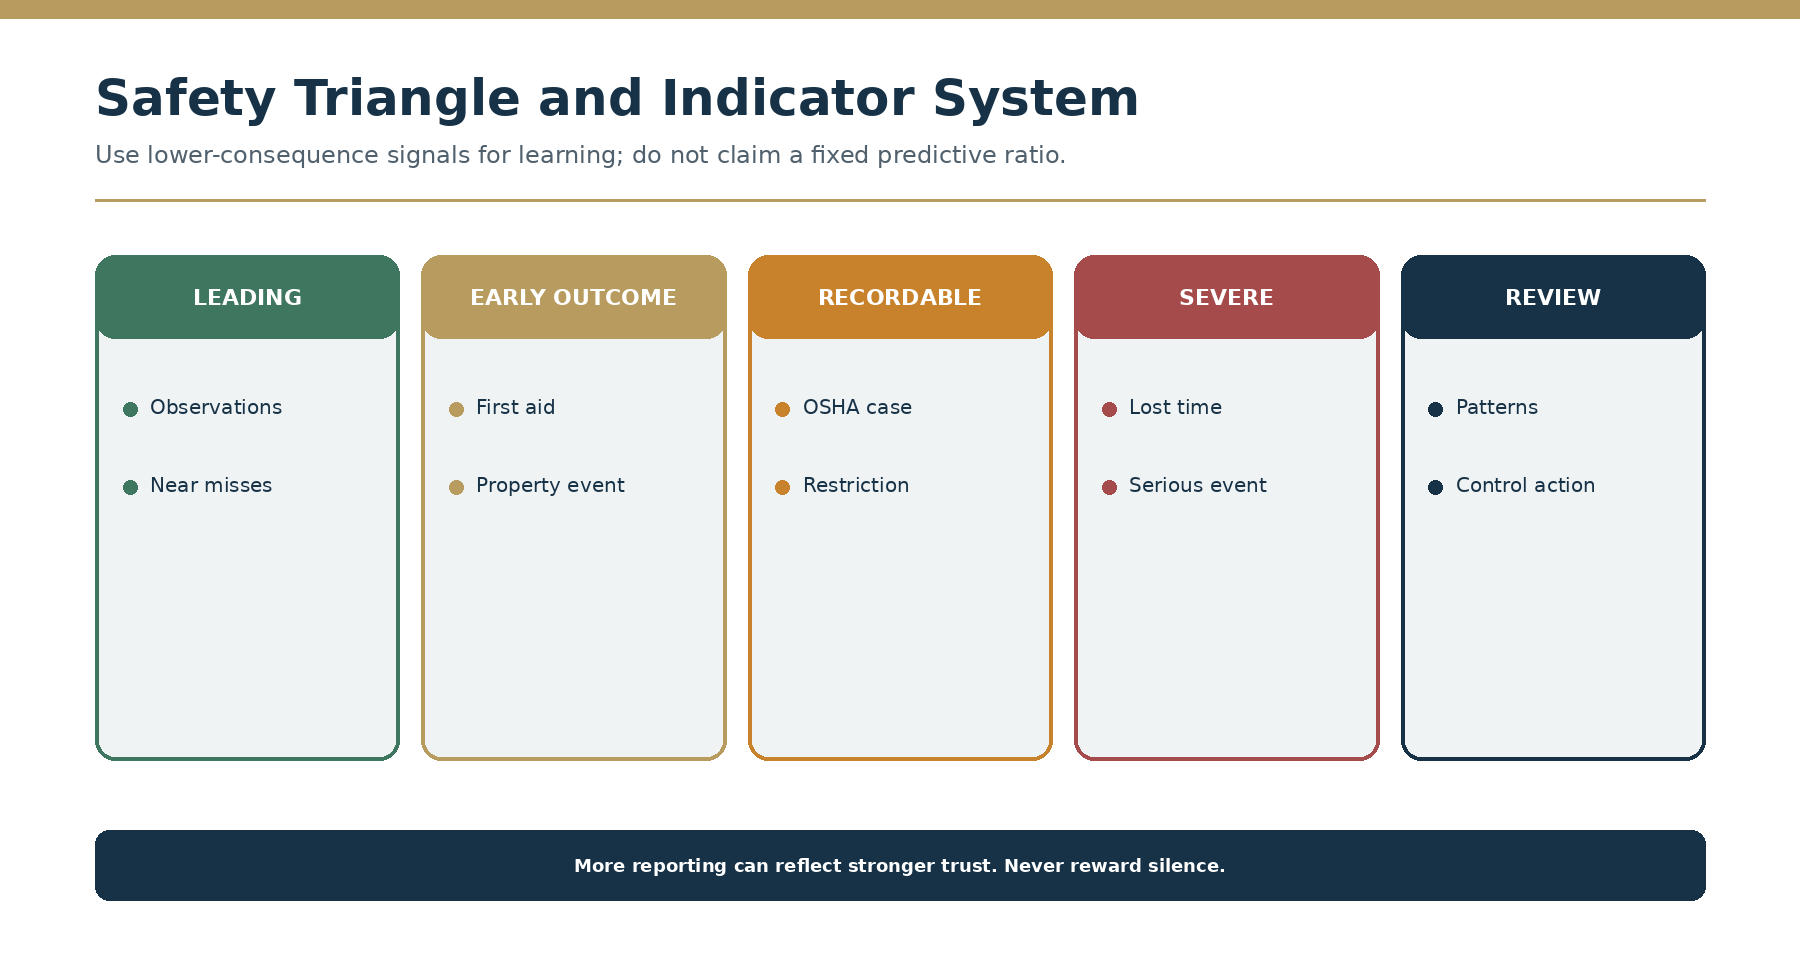
The Safety Triangle organizes observations and near misses at the broad base, followed by first-aid cases, recordables, and lost-time outcomes.
Use it as a learning framework: lower-consequence signals create more opportunities to detect patterns and strengthen controls before severe outcomes.
Do not present the triangle as a universal mathematical ratio or claim that a fixed number of near misses predicts one major injury. Project exposure, reporting culture, definitions, and data quality vary.
Useful leading indicators
- high-risk activities reviewed before start;
- inspections completed as planned;
- critical and high findings overdue;
- closure time by severity;
- repeat and reopened findings;
- worker observations;
- near-miss reporting and investigation;
- toolbox-talk participation and actions;
- certification coverage and upcoming expiration;
- competent-person coverage;
- subcontractor participation;
- management field engagement; and
- control-effectiveness verification.
The best indicators connect activity to risk. “Ten inspections completed” is weaker than “all planned high-risk excavations received competent-person inspections before entry.”
Useful lagging indicators
- first-aid cases;
- OSHA recordables;
- days-away, restricted, or transferred cases;
- lost-time cases;
- severity;
- TRIR and DART;
- property damage;
- environmental events;
- citations; and
- claims.
TRIR and DART can be computed from maintained inputs, and cases can be classified across the Safety Triangle.
Interpret reporting correctly
Observation and near-miss volume may rise when reporting trust improves. Days without incident may be positive, but it can also reflect limited exposure, luck, or underreporting.
Never reward silence. Pair outcome metrics with reporting participation, follow-through, repeat hazards, and control effectiveness.
Executive analytics
A company-wide safety and quality rollup can expose project trends without compressing risk into one opaque score. Leaders should see unresolved high hazards, aging actions, repeat patterns, recordkeeping status, planned high-risk work, certification gaps, outlier employers, and lagging outcomes.
Choose indicators that can drive action
Every leading indicator should have a defined owner, data source, review cadence, threshold, and management response. If leadership cannot explain what decision changes when the indicator moves, the metric is probably decoration.
Segment data carefully. Company totals can conceal a project, trade, activity, shift, or supervisor with concentrated risk. Also normalize exposure where meaningful; raw counts can be misleading when workforce hours or work types change substantially.
Stress-test interpretation
- Falling near-miss reports may indicate improvement—or fear of reporting.
- More inspections may improve coverage—or generate an unmanageable action backlog.
- Faster closure may improve response—or encourage superficial verification.
- Zero recordables may reflect control—or luck and underreporting.
Indicators initiate investigation. They do not replace it.